Digital Analytics in Practice - Activations & Planning Personas
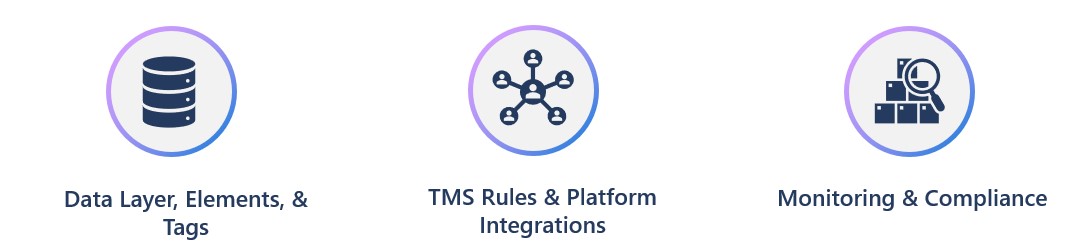
Whether you are planning, activating, or revamping your digital analytics practices and solutions, registering a persona for each beneficiary role will maximize the adoption and smooth the adaptation. Given the major key features of any modern/matured Digital Analytics solutions (Data Layer/Elements/Tags, Tag Management System, Compliance & Monitoring), we can identify the following roles:
- Analytics Developer
- Data Analyst
- Data Architect
- CMS/DAM/Telemetry Developer
- CMS/Content Developer/UX
- Business Owner, Enablement
- Business Owner, Privacy
- Business Owner, Marketing
- Business Owner, Marketing Analytics
- Business Owner, Personalization/Experimentation
Now let's register the appropriate personas per each key feature based on its engagement and/or beneficiary role.
- Data Layer/Elements/Tags
- “As a [Analytics Developer], I want to utilize a data layer, so that analytic implementations are sustainable and scalable.”
- “As a [Data Analyst], I want to utilize a data layer, so that data analysis is trusted and sustainable.”
- “As a [Business Owner, Marketing Analytics], I want to have assurance of our data, so that the analyst can instantly pull data and provide actionable insights.”
- Tag Management System Rules & Platform Integrations
- “As a [Analytics Developer], I want to utilize a tag management system so that I can implement tags and 3rd party pixels compliantly and independently.”
- “As a [CMS/DAM/Telemetry Developer], I want to utilize a tag management system that a centralized approach to deploy, audit and govern implementations.
- “As a [Data Architect], I want to utilize a tag management system architecture that standardizes implementation, models and best practices.
- “As a [Business Owner, Enablement], I want to enforce data engineering governance that aligns with business strategy and data policies.
- Compliance & Monitoring
- “As a [Analytics Developer], I want to react on collected data against the defined KPIs and goals so that I can modify implementations effectively.
- “As a [CMS/DAM/Telemetry Developer], I want to verify scripts implementation across all pages/domains so that my implementation best practices of data collection, standardization, compliance and campaigns are stable.
- “As a [CMS/Content Developer/UX], I want to collect traffic patterns so that it influences the design improvements and page performance."
- “As a [Business Owner, Marketing], I want to find out whether a campaign was effective enough so that I generate a satisfactory ROI."
- “As a [Business Owner, Privacy], I want audit implementation so that I can signoff as PI compliment and reduce the risk of legal penalties.
- “As a [Business Owner, Personalization/Experimentation], I want to reveal customer interest in a page/product/service listing so that offering, and pricing can be personalized."
Digital Analytics in Practice - A Data Governance Toolkit
To better assess a data governance practice model and activation, let’s start from the roots. Data Governance, in practice, encompasses the strategies and technologies used to ensure data is in compliance with regulations and corporate policies with respect to data usage. This shows a need for a way or tool to assess all that. Simply, a categorized questionnaire-driven self-assessment tool can be used here to evaluate and monitor data governance health and to help plan next steps actions and align strategies. This self-assessment questionnaire focuses on evaluating and monitoring 4 categories that make the pillars of this data governance toolkit. They are:
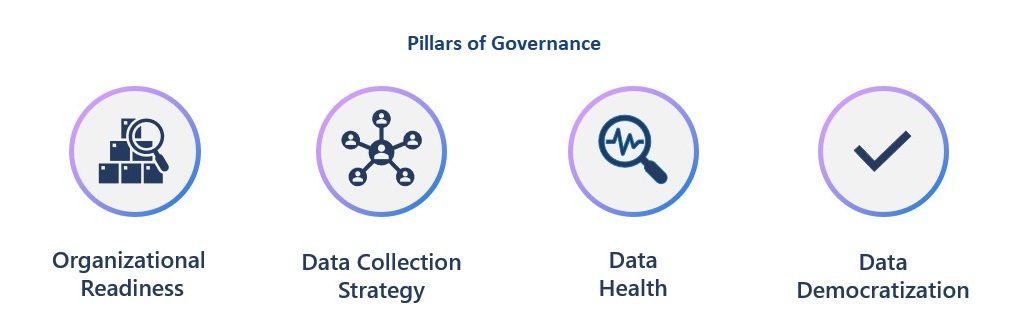
- Organizational Readiness
- Data Collection Strategy: measures the well-being of the process of gathering, measuring, and analyzing accurate customer data that will then be used for marketing and decision-making. A strong scoring here would allow us to collect more information of a higher quality at a lower cost
- Data Health: evaluates how well the organization’s data supports the business objectives. In definition, Data is healthy if it is easily discoverable, understandable, and of value to the people that need to use it, and these characteristics are sustained throughout its lifecycle.
- Data Democratization: offers an insight of how well is the ongoing process of enabling everybody in an organization, irrespective of their technical know-how, to work with data comfortably, to feel confident talking about it, and as a result, make data-informed decisions and build customer experiences powered by data.
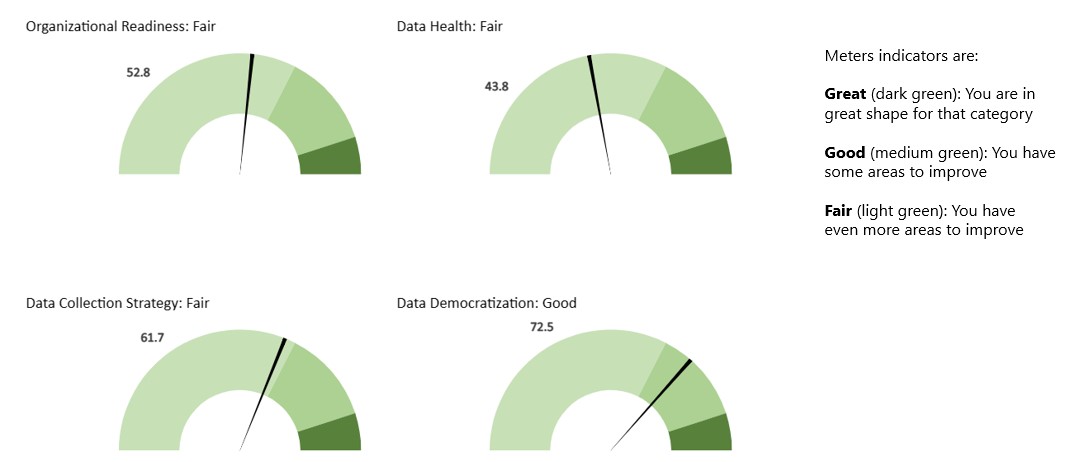
Once answered, you should act and frequently re-evaluate and re-act. Some next steps actions should be:
- Share the output data with executive stakeholders for review and compare against goals, strategy and plans
- Setup/modify action plans for how to improve and move toward "Great"
- Work on those where you answered "Strongly Disagree" or "Disagree" to strengthen those aspects of the data governance
- Apply any or all the runbook phases that was setup along with this data governance toolkit
Digital Analytics in Practice - Core Principles
Digital Analytics is not a tool nor an analysis process. It’s a set of business and technical activities that define, create, collect, verify, or transform digital data into reporting/visualization, analysis, optimizations, simulations, predictions, automations and insights that enable business values and opportunities.
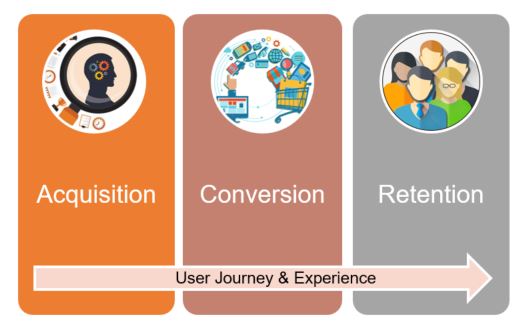
In a highest and best usage model, Digital Analytics helps businesses to drive a continual improvement of any user journey or experience, which translates into increasing revenue and/or a reducing cost.
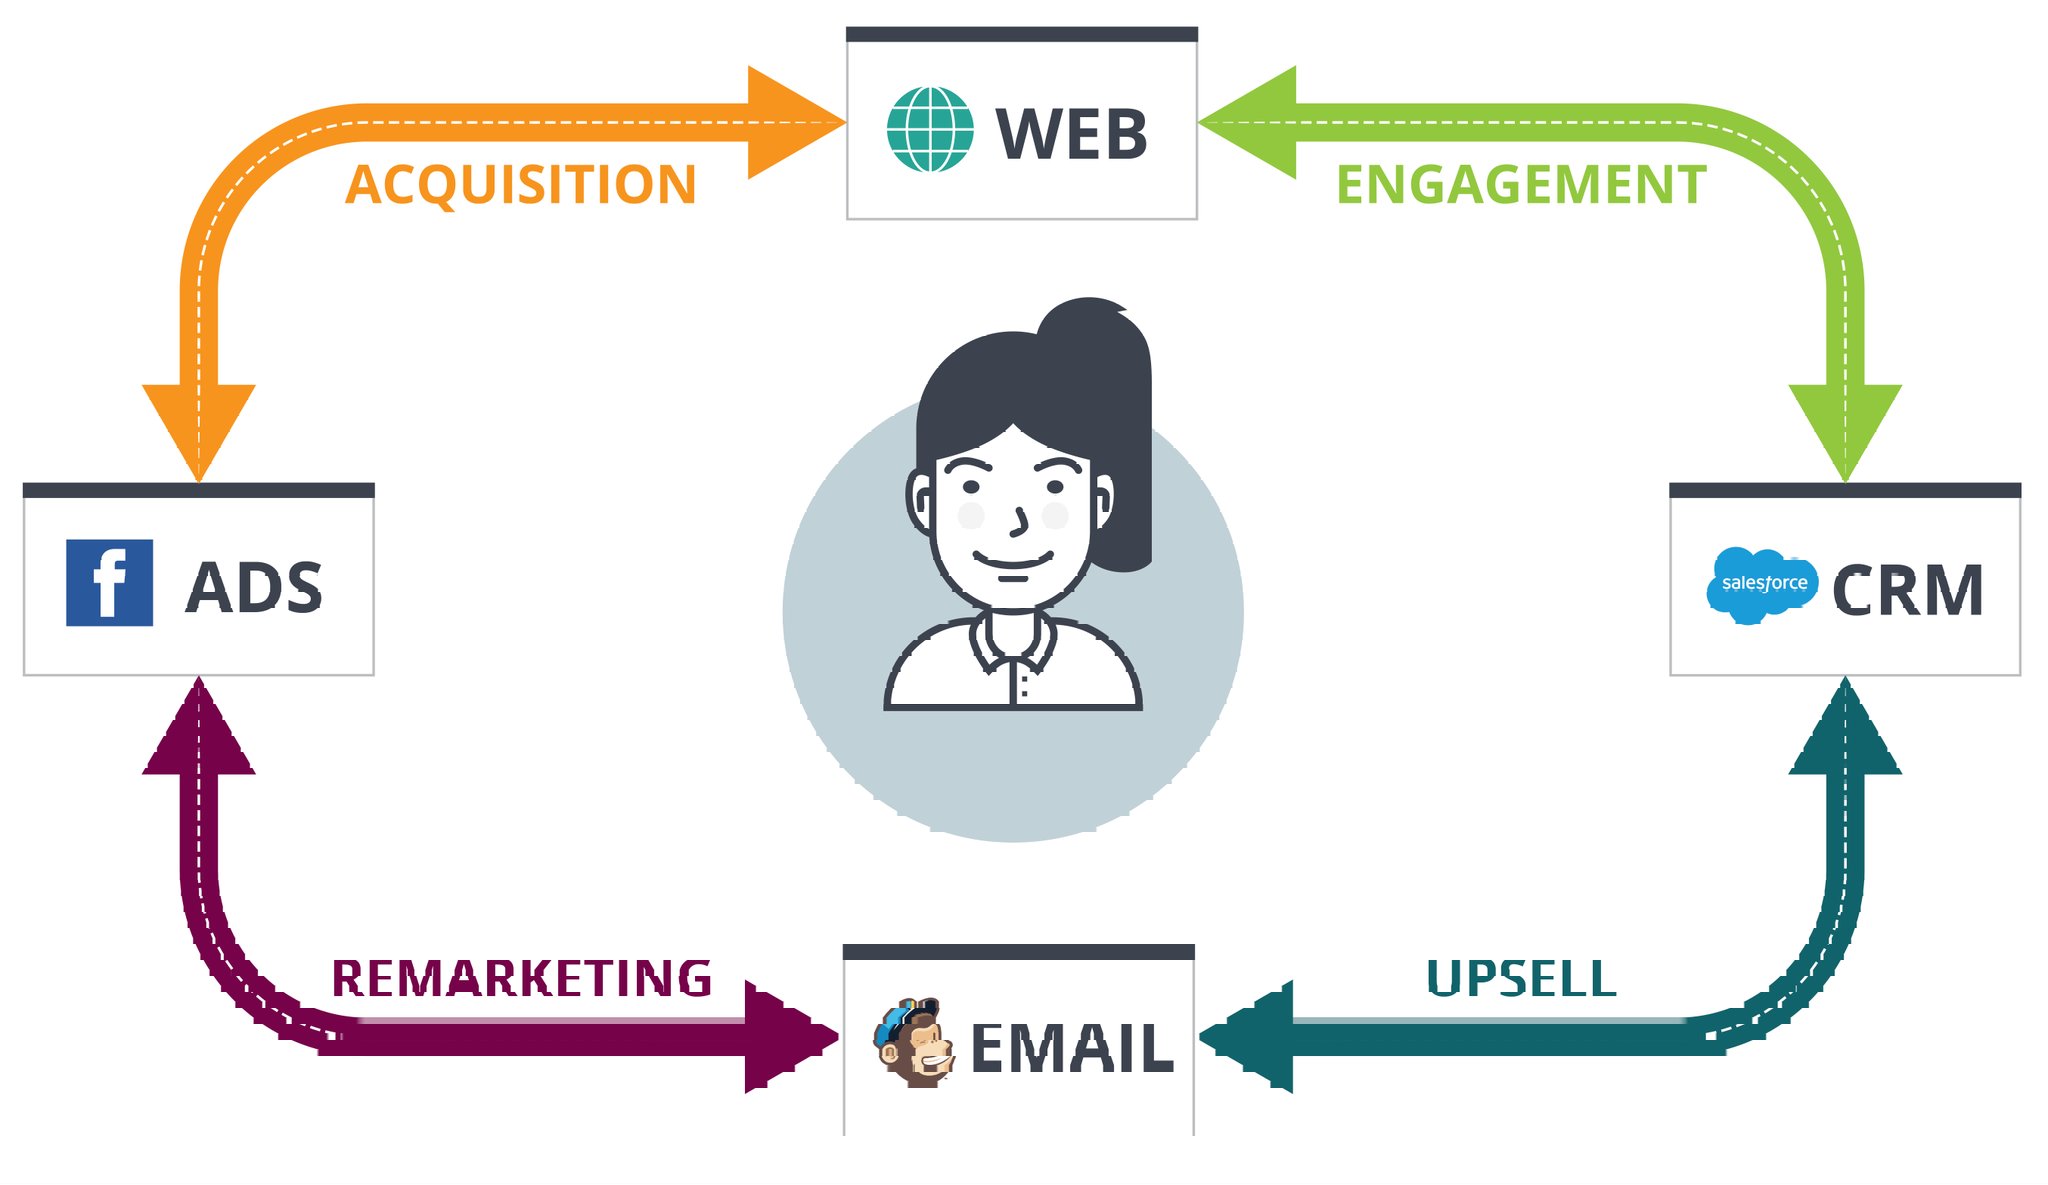
Speaking about the user journey and experience, it's any business' or marketer's ultimate goal to be able to track potential customers/users and understand their Acquisition channels, measure Conversion successful touchdowns and thus foresee how good their efforts are to Retain their business.
Strategically speaking, in general, Digital Analytics could be used for different goals by different people:
- To an executive, Digital Analytics can help to determine if the digital entity and contents have been worth the financial investment. Does it produce results? Are these results improving over time, especially after a redesign?
- To product managers, it can help to reveal customer interest in an array of products and, consequently, affect product offering and pricing
- To an IT manager, it involves determining how much traffic the web, mobile and/or native apps entities experience so that manager can ensure that servers can deliver digital content flawlessly
- To a marketing professional, it helps finding out whether an ad campaign (SEM, display, mobile, shopping, or Video) was actually effective and generated a satisfactory ROI
- To a web content developer, it collects traffic patterns that influence the design improvements
- To a sales person, it tracks which individual customers and prospects have been visiting the digital entities in order to narrow the sales channels and approach for a given customer or prospect
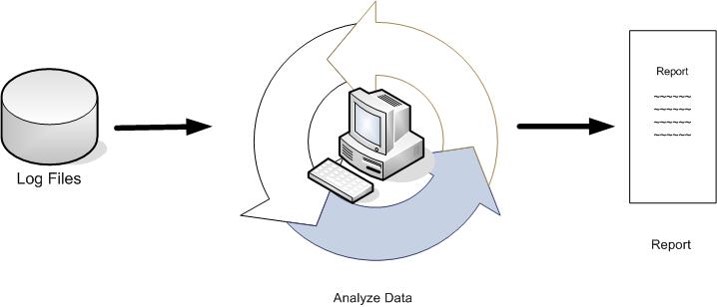
From a mechanics perspective, a Digital Analytics is based on a three step process that is:
- Collect digital activity data
- Analyze the data that interests you
- Create meaningful reports and visualizations on that data
However, choosing a digital data analytics strategy is a business decision that must be made by the corporate leadership that, in a best practice, should consider balancing cost-effectiveness and quality with delivery time, especially when the question is whether to keep, buy or build an analytics solution.
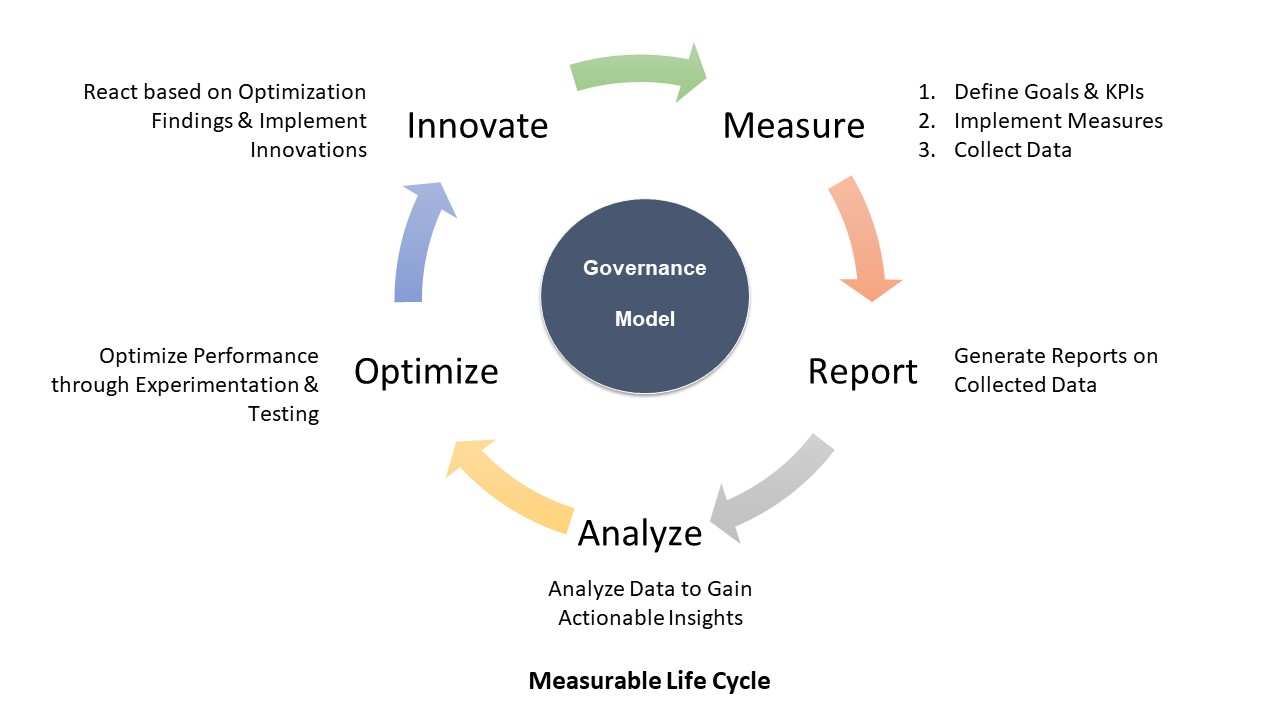
Digital Analytics in Practice - Core Lifecycle
The Measurable Life Cycle is a simple repeatable process that will help you NOT only optimizing your web, mobile and native apps contents by following a few proven steps to find gaps, but also would enable you to find opportunities and innovate products and services that would maximize your user experience and browsing behaviors to the level of personalization and thus generating more revenues and boosting your campaigns ROI. This repeatable process creates a continuous improvement loop in which efforts are repeatedly refined through measurement.
Whether you are starting fresh or re-architecting your data structure, it all starts with gathering business requirements, defining goals and KPIs (Key Performance Indicators), designing the solution, and implementing it before you can start collecting the data. Having the data would allow you to generate analytics reports, illustrate trends visualizations and ultimately tell a story around numbers and findings. For that, you would need to dig into the data, analyze it to find gaps and opportunities and thus gain actionable insights. Those insights would become the core of any experimentation and testing during optimization phase. Based on the optimization outcomes, you should react and come up with innovative products or services to satisfy the voice of your customers. Then, re-measure again for your success keys.
Following this process will help you focus your benchmarks and make critical adjustments to your digital contents by optimization scenarios and traffic/segments simulation models, helping you to improve each time you complete the cycle.